Ranking
 Categories
 Historical Snapshots
 Token unlocks
 Yield
Yield Real-World Assets
 Trending
 Upcoming
 Recently Added
 Gainers & Losers
 Most Visited
 Community Sentiment
 Chain Ranking
 New
New Crypto
 Politics
 Sports
 Finance
 Tech
Tech Overall NFT Stats
 Upcoming Sales
 Market Overview
 Spot Market
 No. of Cryptocurrencies
 Bitcoin Treasuries
 BNB Treasuries
 Exchange Inflows/Outflows
 Fear and Greed Index
 Altcoin Season Index
 Market Cycle Indicators
 Bitcoin Dominance
 CoinMarketCap 20 Index
 CoinMarketCap 100 Index
 Crypto ETFs
 Bitcoin ETFs
 Ethereum ETFs
 RSI
RSI MACD
MACD Overview
 Liquidations
 Funding Rates
 Signals
 Trending
 New
New Gainers
 Meme Explorer
 Top Traders
 Spot
Spot Derivatives
 Spot
Spot Derivatives
 Feeds
Feeds Topics
 Lives
Lives Articles
 Crypto API
 DEX API
 Enterprise
 Pricing
 Documentation
 FAQ
FAQ CMC Agent Hub
 Skills Marketplace
 Hackathon
 CMC MCP
 x402
x402 Converter
 Newsletter
 CMC Launch
 CMC Labs
 CMC Max
 Telegram Bot
 Advertise
 Site Widgets
 News
News Academy
 Research
 Videos
 Glossary
 AI Alerts
 Airdrops
 Diamond Rewards
 Learn & Earn
 ICO Calendar
 Events Calendar
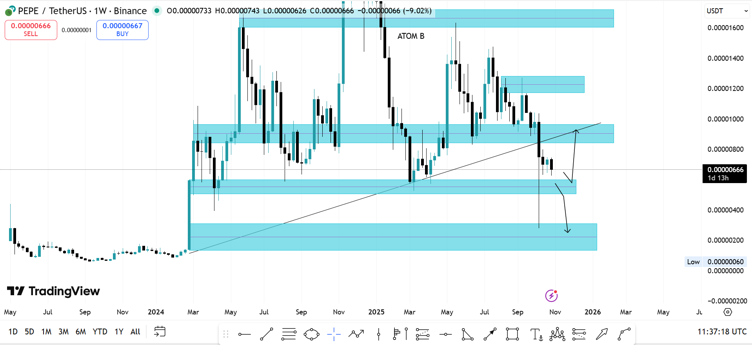
 $PEPE – Trendline Break Signals Deeper Pullback Risk
$PEPE is currently trading around 0.00000066 USDT on the weekly chart, and the recent price action shows a clear break below the ascending trendline that had been supporting the uptrend since early 2023. This breakdown shifts the bias toward bearish, especially as price now sits beneath multiple resistance zones.
The chart highlights several horizontal support and resistance blocks, with price currently hovering just above a key support area. If this zone fails to hold, the next downside target could be the lower support region near 0.00000045, which aligns with previous accumulation levels.
The downward arrow on the chart suggests that sellers are in control for now, and unless price reclaims the broken trendline and closes above the mid-range resistance, the structure favors continued weakness.
This setup reflects a trendline failure with layered support zones, and traders should monitor for signs of stabilization or further breakdown before positioning.