Ranking
 Categories
 Historical Snapshots
 Token unlocks
 Yield
Yield Real-World Assets
 Trending
 Upcoming
 Recently Added
 Gainers & Losers
 Most Visited
 Community Sentiment
 Chain Ranking
 New
New Crypto
 Politics
 Sports
 Finance
 Tech
Tech Overall NFT Stats
 Upcoming Sales
 Market Overview
 Spot Market
 No. of Cryptocurrencies
 Bitcoin Treasuries
 BNB Treasuries
 Exchange Inflows/Outflows
 Fear and Greed Index
 Altcoin Season Index
 Market Cycle Indicators
 Bitcoin Dominance
 CoinMarketCap 20 Index
 CoinMarketCap 100 Index
 Crypto ETFs
 Bitcoin ETFs
 Ethereum ETFs
 RSI
RSI MACD
MACD Overview
 Liquidations
 Funding Rates
 Signals
 Trending
 New
New Gainers
 Meme Explorer
 Top Traders
 Spot
Spot Derivatives
 Spot
Spot Derivatives
 Feeds
Feeds Topics
 Lives
Lives Articles
 Converter
 Newsletter
 CMC Launch
 CMC Labs
 CMC Max
 Top Stories
 Telegram Bot
 Advertise
 Site Widgets
 News
News Academy
 Research
 Videos
 Glossary
 Ask CMC AI
 AI Alerts
 Airdrops
 Diamond Rewards
 Learn & Earn
 ICO Calendar
 Events Calendar
 Crypto API
 DEX API
 Enterprise
 Pricing
 Documentation
 FAQ
FAQ Hackathon
 CMC MCP
 x402
x402
 $AIOZ Analysis 🚀
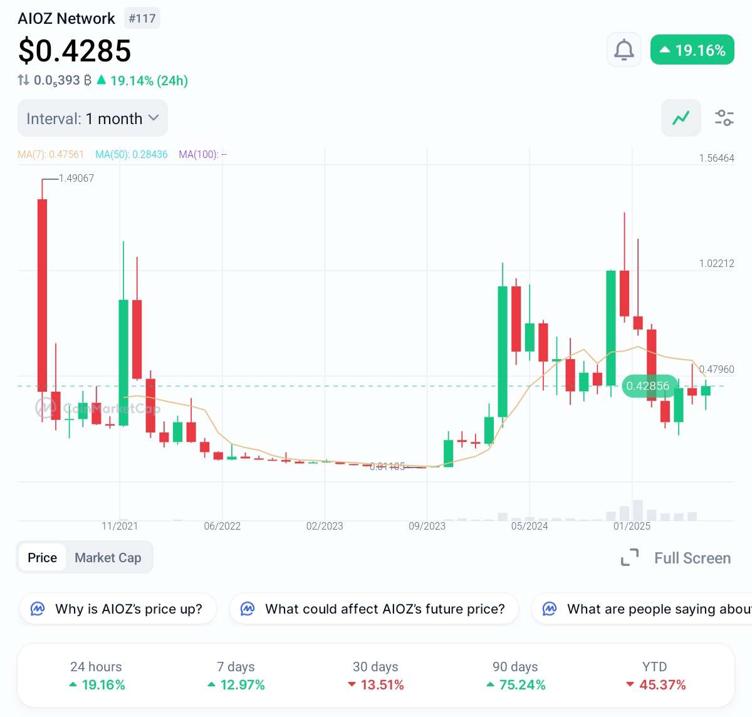
The chart for AIOZ Network (AIOZ) shows a notable upward movement, with the current price at $0.4285, reflecting a 19.16% increase in the last 24 hours. Over the past month, the price has risen from a low of approximately $0.149 to its current level, marked by a series of green candlesticks, indicating a strong short-term bullish trend.
Key observations:
Price Performance: The 24-hour and 7-day gains are 19.16% and 12.97%, respectively, while the 30-day period shows a -13.5% decline. However, the 90-day gain is 75.24%, and YTD is down 45.37%, suggesting a significant recovery after a longer-term downturn.
Technical Indicators: The MA(7) at $0.47561 and MA(50) at $0.28436 show the price is above the 50-day moving average but below the 7-day, indicating potential short-term resistance.
Volatility: The chart displays sharp fluctuations, with a recent spike from a low of $0.149 to a high near $1.564, followed by a pullback and subsequent recovery.
The recent price surge could be driven by increased market interest or project developments, though the YTD loss suggests broader market challenges.