

 Ranking
 Categories
 Historical Snapshots
 Token unlocks
 Yield
Yield Real-World Assets
 Trending
 Upcoming
 Recently Added
 Gainers & Losers
 Most Visited
 Community Sentiment
 Chain Ranking
 New
New  Crypto
 Politics
 Sports
 Finance
 Tech
Tech Overall NFT Stats
 Upcoming Sales
 Market Overview
 Spot Market
 No. of Cryptocurrencies
 Bitcoin Treasuries
 BNB Treasuries
 Exchange Inflows/Outflows
 Fear and Greed Index
 Altcoin Season Index
 Market Cycle Indicators
 Bitcoin Dominance
 CoinMarketCap 20 Index
 CoinMarketCap 100 Index
 Crypto ETFs
 Bitcoin ETFs
 Ethereum ETFs
 RSI
RSI MACD
MACD Overview
 Liquidations
 Funding Rates
 Signals
 Trending
 New
New Gainers
 Meme Explorer
 Top Traders
 Spot
Spot Derivatives
 Spot
Spot Derivatives
 Feeds
Feeds Topics
 Lives
Lives Articles
 Crypto API
 DEX API
 Enterprise
 Pricing
 Documentation
 FAQ
FAQ CMC Agent Hub
 Skills Marketplace
 Hackathon
 CMC MCP
 x402
x402 Converter
 Newsletter
 CMC Launch
 CMC Labs
 CMC Max
 Telegram Bot
 Advertise
 Site Widgets
 News
News Academy
 Research
 Videos
 Glossary
 AI Alerts
 Airdrops
 Diamond Rewards
 Learn & Earn
 ICO Calendar
 Events Calendar
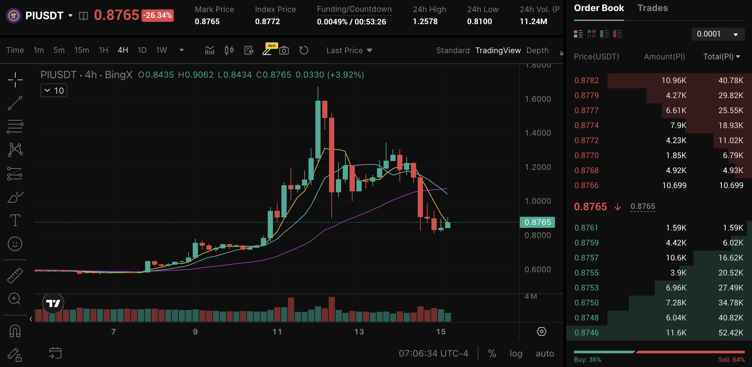
 $PI/
$PI/  $USDT on #BingX (4H chart) is pulling back at 0.54321 as of 06:06 PM +07 on May 15, 2025!
The price hit 0.56666 but faced resistance at 0.55999, showing a sharp red candle—profit-taking in play. Support sits at the 50-period EMA (yellow) around 0.49999, a key level to watch. The uptrend remains intact with higher highs and lows, but this dip could signal a breather.
The True Volatility (TV) indicator below is dropping, hinting at slowing momentum—setting up for a consolidation? Volume spiked during the rally but eased on the pullback, suggesting weaker selling pressure.
Actionable Insight: If $PI holds above 0.49999, bulls might target 0.55999 again. A break below could test 0.46999. Are you buying this dip or waiting for a breakout?
39
6
5
4
3
3