Ranking
 Categories
 Historical Snapshots
 Token unlocks
 Yield
Yield Real-World Assets
 Trending
 Upcoming
 Recently Added
 Gainers & Losers
 Most Visited
 Community Sentiment
 Chain Ranking
 New
New  Crypto
 Politics
 Sports
 Finance
 Tech
Tech Overall NFT Stats
 Upcoming Sales
 Market Overview
 Spot Market
 No. of Cryptocurrencies
 Bitcoin Treasuries
 BNB Treasuries
 Exchange Inflows/Outflows
 Fear and Greed Index
 Altcoin Season Index
 Market Cycle Indicators
 Bitcoin Dominance
 CoinMarketCap 20 Index
 CoinMarketCap 100 Index
 Crypto ETFs
 Bitcoin ETFs
 Ethereum ETFs
 RSI
RSI MACD
MACD Overview
 Liquidations
 Funding Rates
 Signals
 Trending
 New
New Gainers
 Meme Explorer
 Top Traders
 Spot
Spot Derivatives
 Spot
Spot Derivatives
 Feeds
Feeds Topics
 Lives
Lives Articles
 Crypto API
 DEX API
 Enterprise
 Pricing
 Documentation
 FAQ
FAQ CMC Agent Hub
 Skills Marketplace
 Hackathon
 CMC MCP
 x402
x402 Converter
 Newsletter
 CMC Launch
 CMC Labs
 CMC Max
 Telegram Bot
 Advertise
 Site Widgets
 News
News Academy
 Research
 Videos
 Glossary
 AI Alerts
 Airdrops
 Diamond Rewards
 Learn & Earn
 ICO Calendar
 Events Calendar

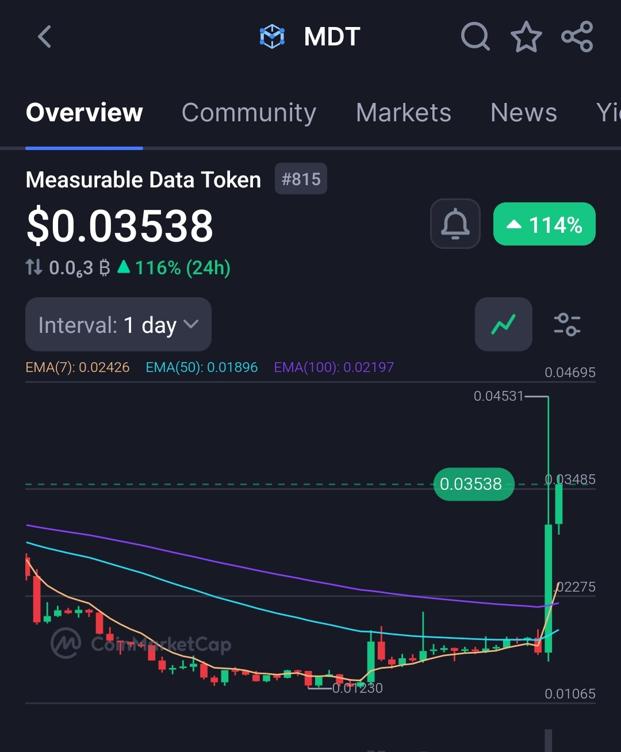
Measurable Data Token (MDT) surged 107% in 24 hours due to bullish technical indicators, positive Q2 financial results, and anticipation of Q3 roadmap milestones.
Overbought RSI (88.7) signals intense buying pressure
Q2 revenue growth (+5% QoQ) and user base expansion
Break above $0.0327 Fibonacci resistance triggered short squeezes
Deep Dive
1. Technical Context
RSI14 at 80.8 (overbought) reflects aggressive accumulation, though hints at potential pullback risk
Price cleared the 38.2% Fibonacci retracement
($0.0327), invalidating bearish setups below this level
MACD histogram at +0.00108 confirms bullish momentum acceleration
2. Primary Catalyst
Q2 financial report (July 14, 2025) showed:
$1.36M data monetization revenue (+5% QoQ)
133K new users opting into MDT’s data-sharing ecosystem
6.42M cumulative users across RewardMe/MailTime apps
3. Market Dynamics
Turnover ratio of 5.44 indicates extreme liquidity churn – typical of low-float alts in momentum plays
Whales control 82.24% of supply, enabling coordinated pumps during low-liquidity periods
Altcoin Season Index (+100% in 30 days) shows capital rotating into microcaps like MDT
Conclusion
MDT’s surge combines technical breakout dynamics with fundamental progress in data monetization, though whale dominance and extreme RSI warrant caution.
Will the Q3 launch of World ID integration (planned for September) sustain retail interest beyond this speculative wave?