Ranking
 Categories
 Historical Snapshots
 Token unlocks
 Yield
Yield Real-World Assets
 Trending
 Upcoming
 Recently Added
 Gainers & Losers
 Most Visited
 Community Sentiment
 Chain Ranking
 Crypto
 Politics
 Sports
 Overall NFT Stats
 Upcoming Sales
 Market Overview
 Spot Market
 No. of Cryptocurrencies
 Bitcoin Treasuries
 BNB Treasuries
 Fear and Greed Index
 Altcoin Season Index
 Market Cycle Indicators
 Bitcoin Dominance
 CoinMarketCap 20 Index
 CoinMarketCap 100 Index
 Crypto ETFs
 Bitcoin ETFs
 Ethereum ETFs
 RSI
RSI MACD
MACD Overview
 Liquidations
 Funding Rates
 Signals
 Trending
 New
New Gainers
 Meme Explorer
 Top Traders
 Spot
Spot Derivatives
 Spot
Spot Derivatives
 Feeds
Feeds Topics
 Lives
Lives Articles
 Converter
 Newsletter
 CMC Launch
 CMC Labs
 CMC Max
 Top Stories
 Telegram Bot
 Advertise
 Crypto API
 Site Widgets
 News
News Academy
 Research
 Videos
 Glossary
 Ask CMC AI
 AI Alerts
 Airdrops
 Diamond Rewards
 Learn & Earn
 ICO Calendar
 Events Calendar
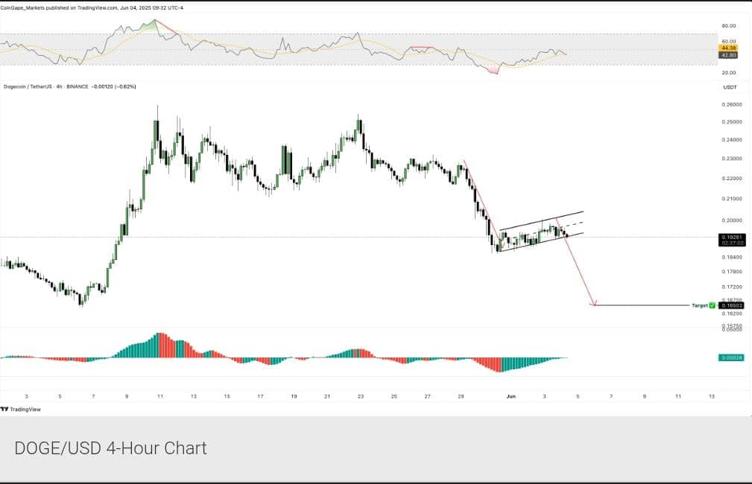
The 4-hour  $DOGE chart shows a potential bear flag pattern. The initial 18% drop from May 29–31 formed the flagpole, followed by an upward consolidation (the flag). A breakdown could occur if DOGE closes decisively below the flag’s lower trendline.
Currently, DOGE is trading at $0.188, down 2.59% from its intraday high of $0.0204. The RSI faces rejection near the midline, indicating weak buying pressure. Meanwhile, the Awesome Oscillator (AO) shows tentative bullish signs as the histogram approaches the zero line, suggesting a possible recovery attempt.
However, broader market uncertainty, particularly around Bitcoin’s short-term outlook, may influence DOGE’s trend. If  $BTC weakens further, DOGE and other altcoins could face additional downward pressure.