Ranking
 Categories
 Historical Snapshots
 Token unlocks
 Yield
Yield Real-World Assets
 Trending
 Upcoming
 Recently Added
 Gainers & Losers
 Most Visited
 Community Sentiment
 Chain Ranking
 New
New  Crypto
 Politics
 Sports
 Finance
 Tech
Tech Overall NFT Stats
 Upcoming Sales
 Market Overview
 Spot Market
 No. of Cryptocurrencies
 Bitcoin Treasuries
 BNB Treasuries
 Exchange Inflows/Outflows
 Fear and Greed Index
 Altcoin Season Index
 Market Cycle Indicators
 Bitcoin Dominance
 CoinMarketCap 20 Index
 CoinMarketCap 100 Index
 Crypto ETFs
 Bitcoin ETFs
 Ethereum ETFs
 RSI
RSI MACD
MACD Overview
 Liquidations
 Funding Rates
 Signals
 Trending
 New
New Gainers
 Meme Explorer
 Top Traders
 Spot
Spot Derivatives
 Spot
Spot Derivatives
 Feeds
Feeds Topics
 Lives
Lives Articles
 Crypto API
 DEX API
 Enterprise
 Pricing
 Documentation
 FAQ
FAQ CMC Agent Hub
 Skills Marketplace
 Hackathon
 CMC MCP
 x402
x402 Converter
 Newsletter
 CMC Launch
 CMC Labs
 CMC Max
 Telegram Bot
 Advertise
 Site Widgets
 News
News Academy
 Research
 Videos
 Glossary
 AI Alerts
 Airdrops
 Diamond Rewards
 Learn & Earn
 ICO Calendar
 Events Calendar
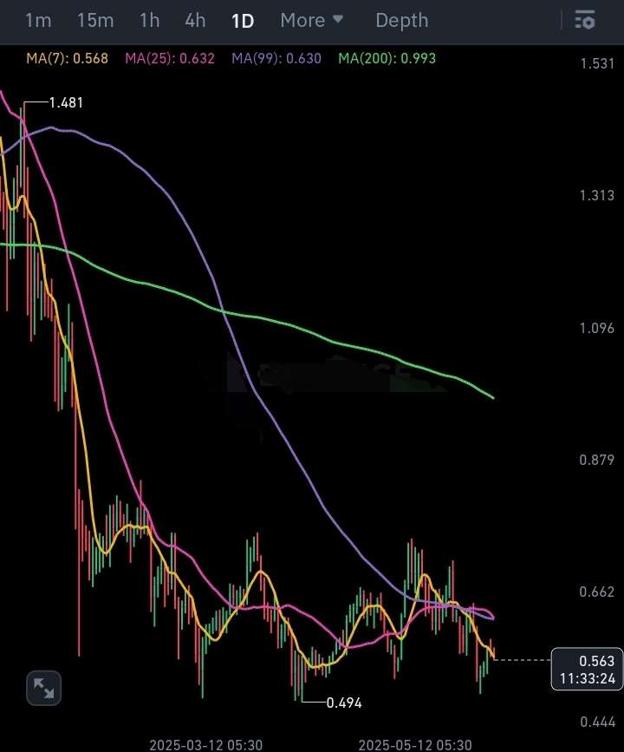
 $DYDX Daily Chart Breakdown
Price is still under heavy pressure, with price sitting at $0.563 after failing to reclaim key moving averages.
🔎 TECHNICAL ANALYSIS :
🔻 Price peaked at $1.48 in March, now down over 60%
💔 Still trading below the 200MA ($0.993) — long-term bearish structure
🟣 99MA ($0.63) and 💗 25MA ($0.632) acting as dynamic resistance
🔄 Local support near $0.49 — break below could trigger another leg down
Momentum is weak, and every bounce is being sold into — classic signs of a distribution phase.
🌎 Macroeconomic Pressures:
📉 Risk-off sentiment as U.S. job market shows signs of cooling
🤑 Traders are rotating back into USD and US Treasuries as yields tick up
💡 Crypto liquidity is thinning, and speculative DeFi tokens like #DYDX are feeling the brunt
On top of that, token unlocks and poor tokenomics are adding sell pressure.
📌 What to Watch:
If DYDX can't hold above $0.55–$0.49, expect a deeper breakdown
A bullish reversal requires a daily close above $0.63, reclaiming the 25/99 MA zone
For now, trend remains bearish — this is a wait-and-see zone, not a chase
📉 #DYDX is still trapped in a macro downtrend. Until structure changes or broader sentiment shifts, caution is key.