 Ranking
 Categories
 Global Charts
 Historical Snapshots
 Bitcoin ETFs
 Token unlocks
 Trending
 Upcoming
 Recently Added
 Gainers & Losers
 Most Visited
 Overall NFT Stats
 Chain Ranking
 Hot DEX Pairs
 Spot
Spot Derivatives
 Spot
Spot Derivatives
 Feeds
Feeds Topics
 Lives
Lives Articles
 Converter
 Newsletter
 CMC Labs
 Telegram Bot
 Advertise
 Crypto API
 Site Widgets
 Airdrops
 Diamond Rewards
 Learn & Earn
 ICO Calendar
 Events Calendar
 Academy
 Research
 Videos
 Glossary
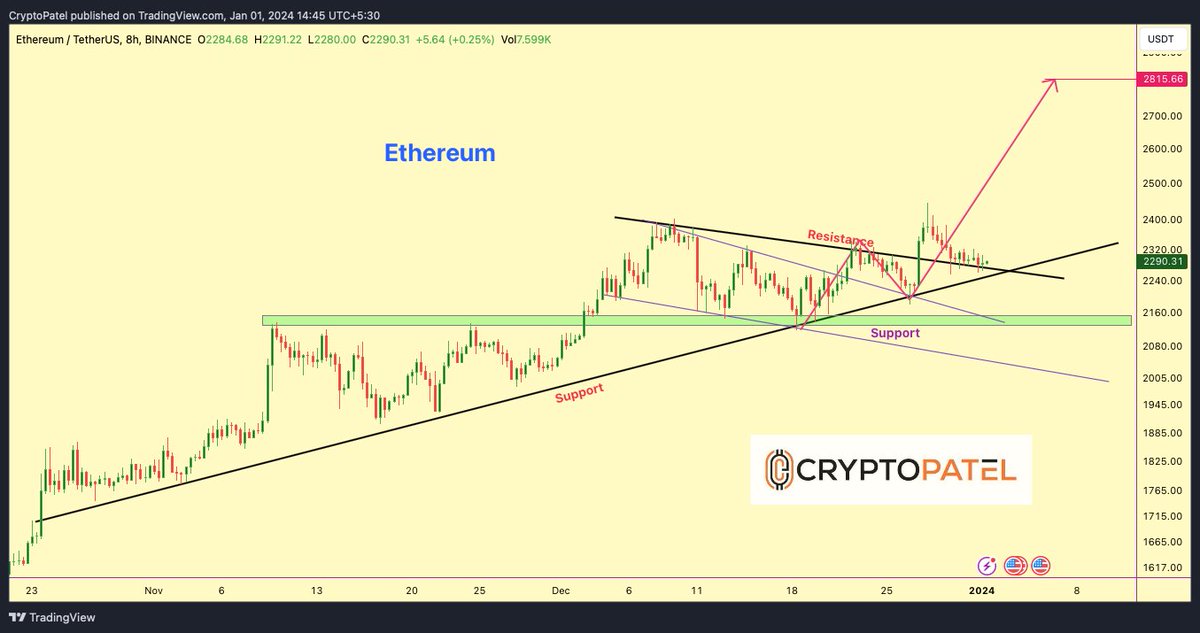
 $ETH Chart Pattern:
#Ethereum price is currently experiencing a bullish pattern in higher time frames, forming both a symmetrical triangle and a bull flag.
The breakout and subsequent retest of the support level have been confirmed, indicating a potential target of $2,800.
However, if the price of #ETH breaks down below the $2,240 support level, it could turn bearish, potentially dropping to the $1,900-$2,000 range.
It is always important to trade with caution, considering the trend and confirmations before making any decisions.
Twitter@CryptoPatel|09:15 AM - Jan 1, 2024
47
10
3
3
3
2
1